When you see empty shelves in the supermarkets and people panic buying on TV, you can’t stop feeling that you are going to miss out – even though all the experts tell you that you won’t.
In much the same way with investment portfolios and despite the fact that we knew that we were taking an agreed level of risk, we still feel a little panicky and have an urge to sell. This makes our role in rationalising and reassuring all the more important.
It is not untypical at Dynamic Planner for us to field calls or challenges that our return assumptions are too conservative and that the risks that we expect had gone away. Of course, Dynamic Planner’s risk and return assumptions cater for markets events like we have been experiencing in March and which remain entirely correct and valid.
As you may very well know, at Dynamic Planner we efficiently and effectively assess the risk of any combination of asset classes – and in the case of Dynamic Planner risk profiled solutions, any combination of investment instrument or holding.
Fund managers are all different and will be using their own mandates, capability, and expertise to try and deliver the best return for the risk taken, pretty much in real-time. They will be issuing their own communications about recent market events and what they intend to do, and that will be informative for you and for your clients invested in those funds.
The markets themselves – how are they being impacted? Equity markets, especially developed markets, are down approximately by 10%. From a peak last month on 19 February, the drops can be read below:
| Index Name | Peak to Trough Loss | 5% Annual Loss (Expected) |
| S&P 500 | – 17.395% | – 24.02% |
| FTSE 500 | – 20.00% | – 24.31% |
| Euro Stoxx 50 | – 23.44% | – 31.56% |
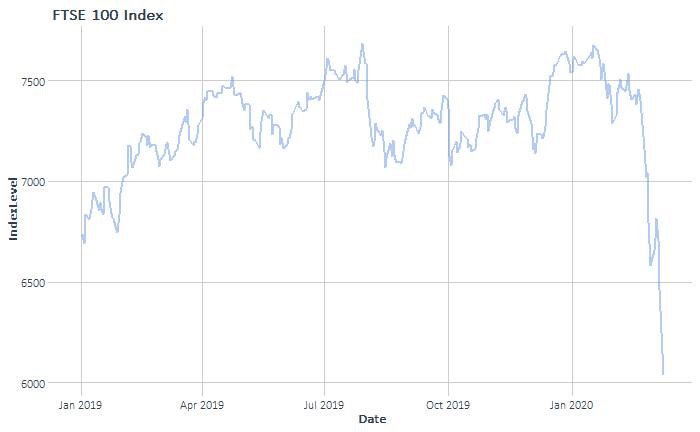
The move, also, in the FTSE 100 can be seen above – and these are big moves, especially over so short a period. For context, the last such moves were witnessed in H2 2018, but they happened over almost six months.
In terms of our modelling at Dynamic Planner, we remain quite confident. We use long-term models for our volatility estimation – and we have been criticised for high numbers here. The three graphs below show that even with these vehement moves, the ‘realised’ rolling volatility on these benchmark indices over the last 10 years have just started approaching the long-run numbers.
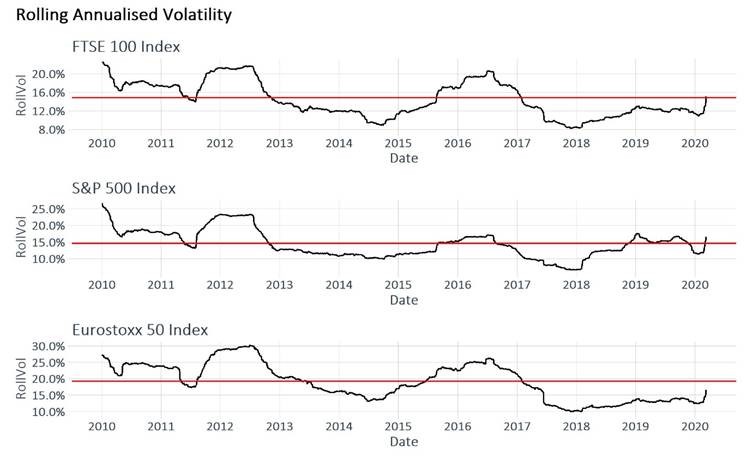
As can be seen above, the FTSE 100, after a 20% loss, has just reached the levels of expected volatility after facing placid conditions since 2016. In short, conditions like these explain why our volatility numbers are higher, because they incorporate dramatic moves as part and parcel of an investment cycle.
From our perspective, you can be reassured you that you can stand by the risk and the return you have led your clients to expect – and that unless there has been a change in the client’s circumstances, they should stay invested.
Remember – just because you could not see the risks, that didn’t mean that they weren’t there. And just because you haven’t had the returns today, that doesn’t mean you won’t get them tomorrow.
For more information on how Dynamic Planner can help your firm, book a demo with one of our team.